Where do I find usage statistics
The Dashboard function within the Smart Trip Tools section of the Portal has all smart trip usage data.
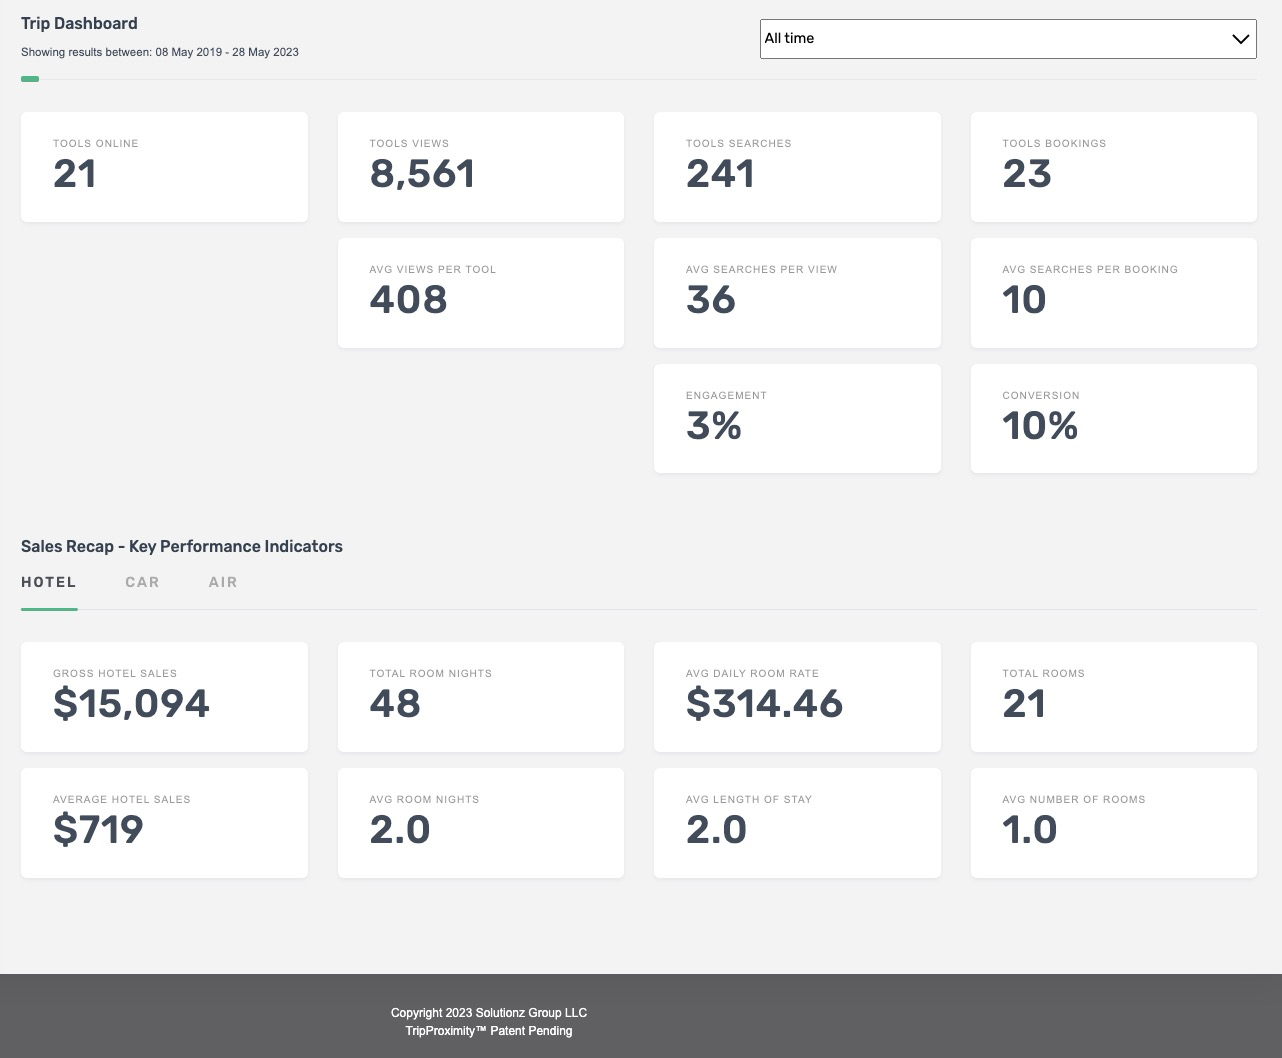
The Trip Dashboard
The Trip Dashboard provides a recap for all tools within the specified timeframe for all smart trip tools.
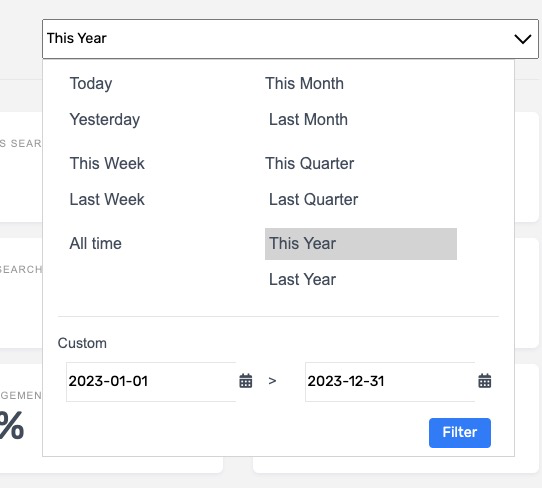
Time Breakdown Filter
The Dashboard can be filtered by the following preset timeframes, or the user may enter a custom timeframe. The default is This Year. Also available is All Time.

Stats
Tools
This number reflects the number of tools that have been built. They are not necessarily those that are installed and active. If your tools have not been installed, we recommend that you change them to Archived, so that they will not be included in the stats.
Total Views
For those tools that have been installed, this recaps the number of times they have been viewed in the specified timeframe.
Average Views per Tool
The total number of views divided by the total active tools. This number may be distorted if you do not mark your unused tools as archived.
Total Searches
The total number of times that a trip element (hotel, car, air) has had the Search button pressed.
Average Searches per View
This is a calculation of the total searches divided by the number of views.
Engagement
This is the percentage of views that resulted in a search. If this number is over 4.6%, and the account is a Level 3 account, it is eligible for a 10% bonus royalty for the month in which the average is maintained or exceeded.
Total Bookings
The total number of times that a search resulted in a booking.
Average Bookings per Search
This is a calculation of the total bookings divided by the number of searches.
Conversion
This is the percentage of searches that resulted in a booking. 1.2% is the national average for ecommerce systems. Our average is 4.6%.
This example is a membership organization that experienced a 10% conversion rate on their searches to bookings for their events.

Sales Recap
Hotel

The stats for the specified timeframe listed include:
- Total sales (gross bookings)
- Total room nights booked
- Average Daily Room Rate (ADR) for all bookings during the specified timeframe
- Total number of rooms booked
- Average booking amount
- Average room nights (1.1 is the average number of room nights per booking)
- Average length of stay (1.2 is the national average)
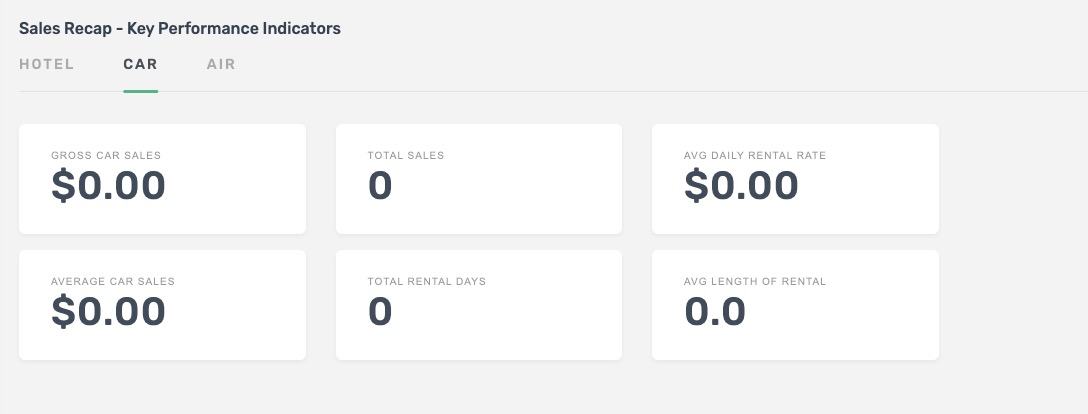
Car

The stats for the specified timeframe listed include:
-
- Total car sales (gross bookings)
- Total number of sales (e.g. car rentals)
- Average Daily Rental Rate for all bookings during the specified timeframe
- Average car sales booking amount
- Total rental days booked
- Average length of rental (1.2 days is average)
Air

The stats for the specified timeframe listed include:
-
- Total air sales (gross bookings)
- Total number of tickets sold
- Total passengers
- Average air sales booking amount
- Average trip length
- Average ticket value
- Average passengers per sale
If you have more questions about the usage statistics available to our clients, during business hours select the CHAT icon in the lower right, or set up a time to talk to one of our Client Success specialists.
Site placement is easy.
The TravelingToGive widget conforms to the HTML container added to your site. Choosing a location near customers’ decision points creates greater value for you.


